Yves here. As much as readers may already have an intuitive grasp of the story told in this post, data can help define its contours better. Here we see that the rising tide of global growth has not lifted all boats. The gains of the once-poor in China and India have come at the expense of the what used to be the middle class in more developed countries. Reducing poverty has not been a zero sum game. This post also omits another key piece: the rise and rise of an uber-wealthy class.
By Leith van Onselen who has previously worked at the Australian Treasury, Victorian Treasury and Goldman Sachs. You can follow him on Twitter at twitter.com/leithvo. Originally published at MacroBusiness
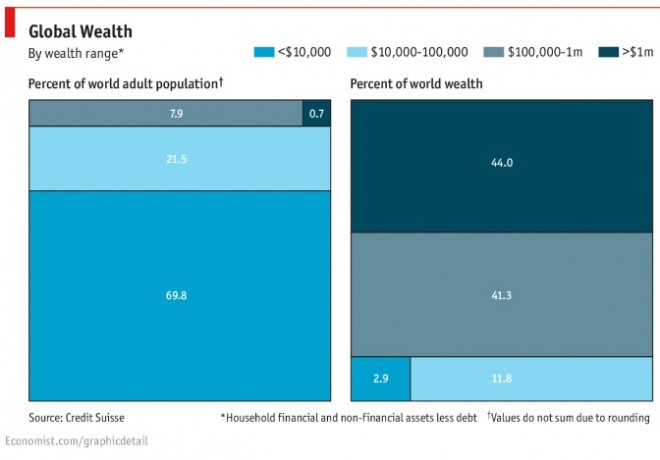
The Economist has published a neat new chart showing the extent of global wealth inequality, drawing on data from Credit Suisse’s latest global wealth report:
According to The Economist:
GLOBAL wealth has increased from $117 trillion in 2000 to $262 trillion this year. That comes to $56,000 for each adult on earth. But the fortune is far from evenly distributed… Today 94.5% of the world’s household wealth is held by 20% of the adult population…
Wealth is so unevenly distributed, that you need just $3,650 (less debts) to count yourself among the richest half of the world’s population. A mere $77,000 brings you among the wealthiest 10%. And just $798,000 puts you into the ranks of the 1%…
Taking a global perspective, the data is more encouraging, with recent research from World Bank researchers, Christoph Lakner and Milanovic Branko, arguing that there has been an overall reduction in poverty via a redistribution of wealth from richer to poorer countries, which has been achieved through greater inequality within rich nations (i.e. a transfer from the poor and middle classes to rich plutocrats). From VOX:
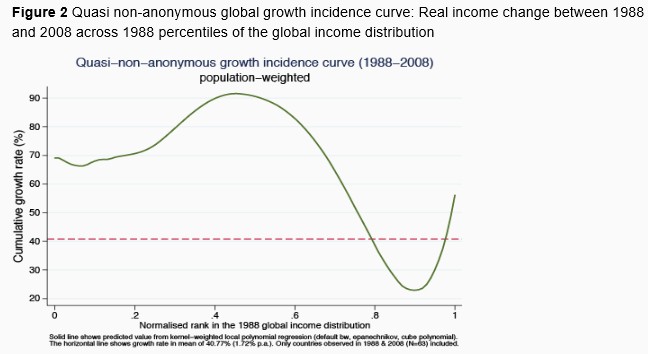
A ‘quasi non-anonymous’ growth incidence curve in Figure 2… shows how the country/deciles that were poor, middle-class, rich, etc. in 1988 performed over the next 20 years…
People around the median almost doubled their real incomes. Not surprisingly, 9 out of 10 such ‘winners’ were from the ‘resurgent Asia’. For example, a person around the middle of the Chinese urban income distribution saw his or her 1988 real income multiplied by a factor of almost 3; someone in the middle of the Indonesian or Thai income distribution by a factor of 2, Indian by a factor of 1.4, etc.
It is perhaps less expected that people who gained the least were almost entirely from the ‘mature economies’ – OECD members that include also a number of former communist countries. But even when the latter are excluded, the overwhelming majority in that group of ‘losers’ are from the ‘old, conventional’ rich world. But not just anyone from the rich world. Rather, the ‘losers’ were predominantly the people who in their countries belong to the lower halves of national income distributions. Those around the median of the German income distribution have gained only 7% in real terms over 20 years; those in the US, 26%. Those in Japan lost out in real terms…
The striking association of large gains around the median of the global income distribution – received mostly by the Asian populations – and the stagnation of incomes among the poor or lower middle classes in rich countries, naturally opens the question of whether the two are associated…
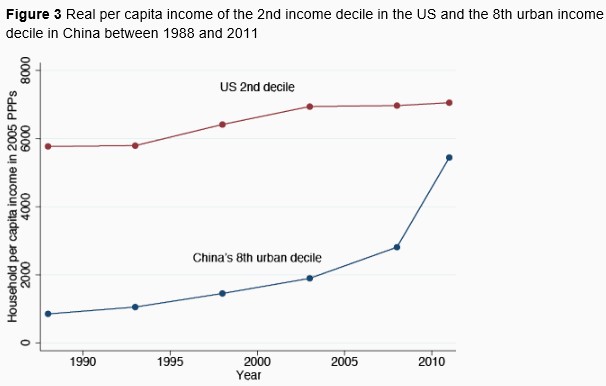
While the real income of the US 2nd decile has increased by some 20% in a quarter century, the income of China’s 8th decile has been multiplied by a factor of 6.5. The absolute income gap, still significant five years ago, before the onset of the Great Recession, has narrowed substantially.
…if we take a simplistic, but effective, view that democracy is correlated with a large and vibrant middle class, its continued hollowing-out in the rich world would, combined with growth of incomes at the top, imply a movement away from democracy and towards forms of plutocracy.
An updated paper by the World Bank, released last week, also found that global poverty has improved significantly since 1990, whereby “the number of people living in extreme poverty has halved, to around one billion people, or 14.5 percent of the world’s population”. Again, the key drivers of these gains since 1990 are the rise of China and India, which together account for around one third of the global population.
Overall, one’s views on whether inequality and poverty is worsening probably depends upon where one lives. The rapid growth in Asia that has lifted billions out of poverty has been a remarkable achievement. However, this has been achieved, in part, at the expense of lower-to-middle income earners in the developed world, where the middle classes have been hollowed-out.
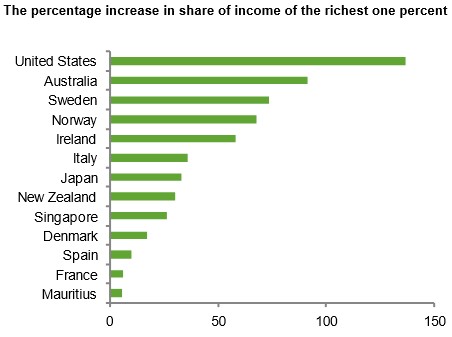
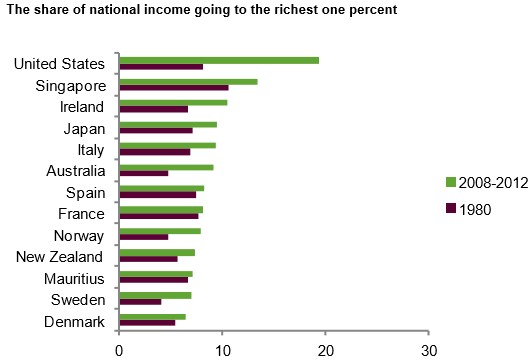
The World Bank’s argument about the hollowing-out of the middle class in advanced economies, implying a movement away from democracy towards plutocracy, is also supported by a report published earlier this year from Oxfam. Oxfam found that the richest 1% increased their share of income in 24 out of 26 countries for which data was available between 1980 and 2012, with the wealthiest 1% in the US capturing 95% of post-financial crisis growth since 2009, whereas the bottom 90% became poorer (see below charts).
Oxfam also warned that the increasing concentration of economic resources in the hands of fewer people (the “plutocrats”) presents a major threat to political and economic systems. In particular, people are becoming increasingly separated by economic and political power, leading to heightened social tensions and increasing the risk of societal breakdown. Laws are also increasingly favouring the rich, driven by a “power grab” by wealthy elites, who have co-opted the political process to rig the rules of the economic system in their favour.
Unfortunately for those living in rich nations, inequality is likely to worsen before it gets better, as improvements in technology and robotics places at risk a large number of skilled jobs, hollowing-out the middle class even further and increasing returns to owners of capital at the expense of labour.
By Yves Smith
http://www.nakedcapitalism.com/2014/10/mixed-international-picture-poverty-inequality.html?utm_source=feedburner&utm_medium=email&utm_campaign=Feed%3A%20NakedCapitalism%20%28naked%20capitalism%29

Awsome post and straight to the point. I am not sure if this is truly the best place to ask but do you guys have any ideea where to employ some professional writers? Thx 🙂